We recommend trying the following solutions:
1) Use our mirror site: https://mirror.mvsep.com
2) Upload the file via our Remote feature: https://mvsep.com/remote — this allows our server to download the file directly from your link.
3) Try using a VPN.
4) Try switching your internet connection (e.g., connect to a different Wi-Fi network or use mobile data).
5) Use the "Export to Google Drive" or "Export to Yandex Disk" options. Downloading from these services is usually much faster.
6) Try using our bots on Telegram or Discord.
In most cases, this means our processor was unable to correctly read the input file due to a format issue. We recommend re-encoding it to WAV (preferred), FLAC, or MP3 and trying again.
Bleedless and Fullness. These metrics use magnitude spectrogram differences between estimated and reference signals, mapped to a mel frequency scale and decibel (dB) domain to align with human auditory perception. In this framework, positive values indicate unwanted added signals (e.g., bleed, artifacts), while negative values indicate missing content (e.g., lost harmonics, missing instruments). The Bleedless metric penalizes average positive differences, while the Fullness metric penalizes average negative differences. In other words, the Bleedless metric quantifies how much of the estimated signal bleeds into the reference signal. The Fullness metric evaluates how completely the target source has been preserved. Both metrics are normalized to a range of [0, 100] with higher values indicating better performance.
Figure below illustrates these concepts through color coding. The blue areas show what is missing from the predicted stem compared to the original, resulting in a lower Fullness score. More blue indicates more missing content. The red areas show unwanted content appearing in the predicted stem that is not present in the original. This represents bleed from the other stems, resulting in a lower Bleedless score. More red indicates more interference from the other instruments.
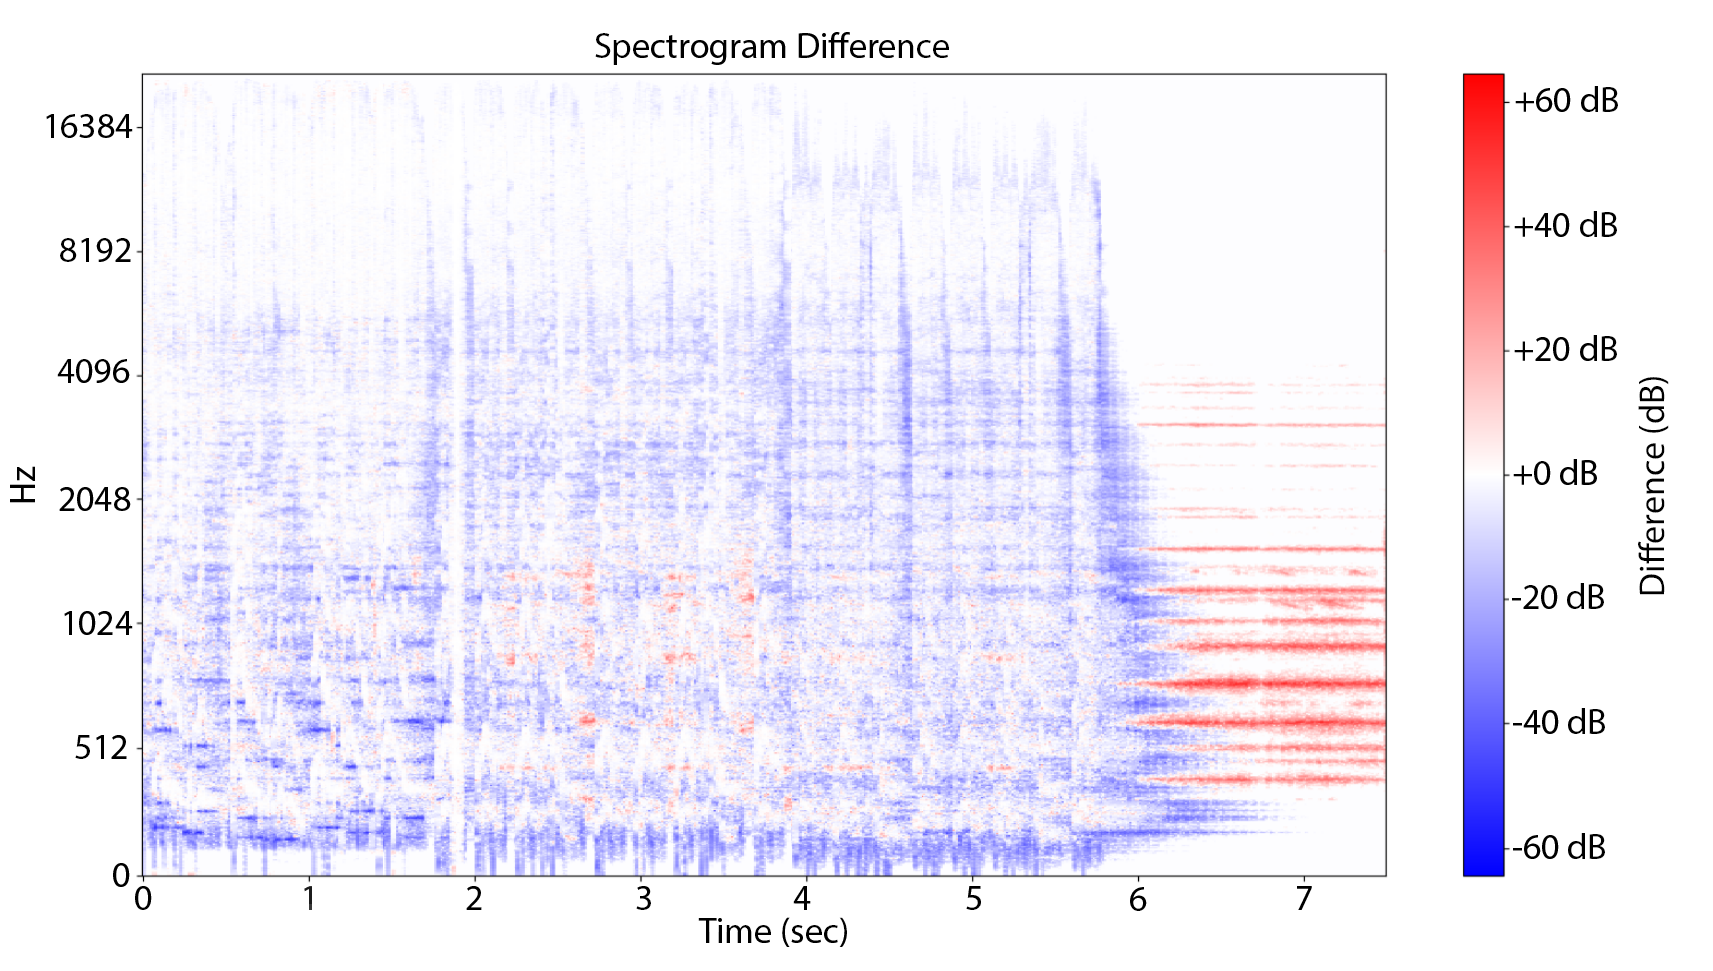
Fullness and Bleedless are usually mutually exclusive during training: as one increases, the other decreases, and metrics can fluctuate significantly. One can have models that emphasize fuller extraction of an instrument but add some noise, and models that make extraction less noisy at the cost of losing some instrument data. The code implementation for all metrics is available on github.
When a model processes audio, a long signal is split into fixed-length chunks. Overlap is the degree of overlap between adjacent windows.
For example:
overlap = 0% → windows are placed back-to-back (no overlap)
overlap = 50% → each subsequent window overlaps the previous one by half
overlap = 75% → 75% overlap, and so on
Overlap helps smooth transitions between windows, use more context, and improve separation quality. Most models on the site use 50% overlap unless stated otherwise. A more visual explanation is shown in the illustration below: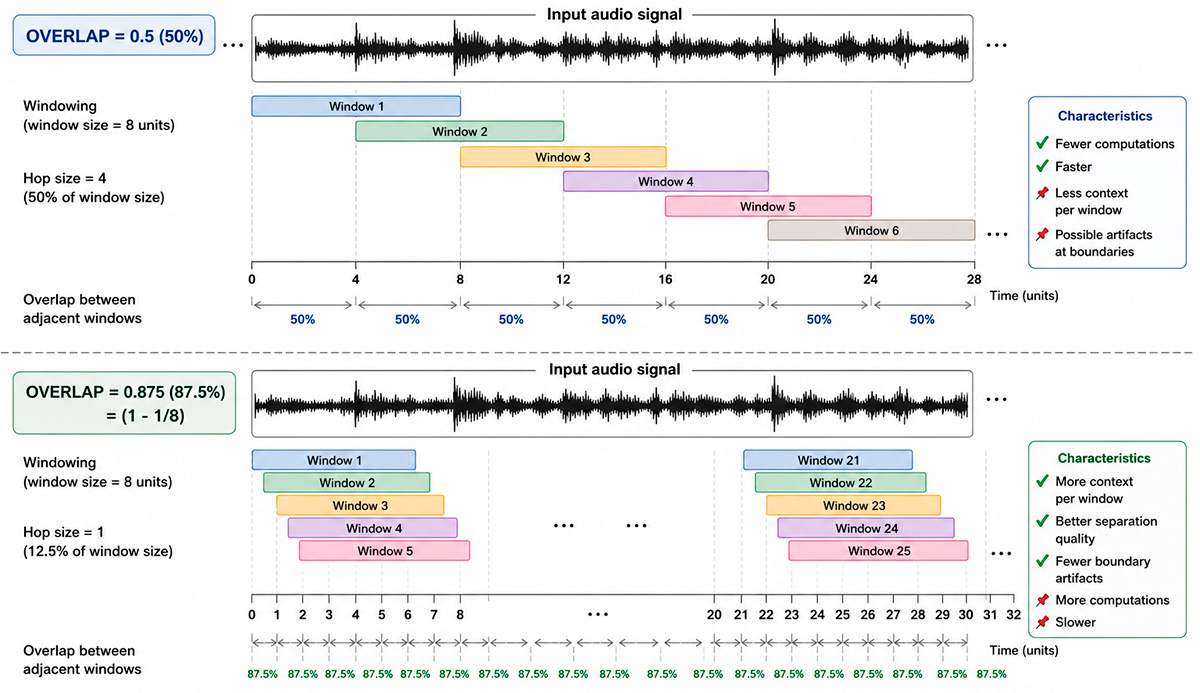
Paddle does not support some emails like Yandex, Mail.ru, etc. We recommend you to register to the site with Gmail, Yahoo and try again.
Please kindly mail to turbo@mvsep.com, suggesting to add your language to the list of languages.